
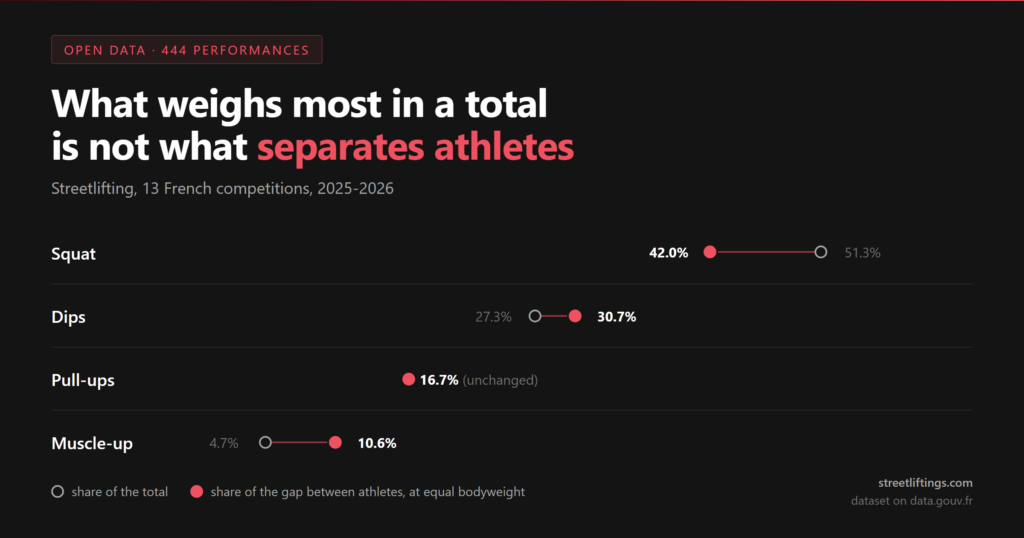
The squat accounts for half of a streetlifting total. It is the heaviest movement, the one that takes up the most training time, and the one everyone talks about. Yet it is not what separates athletes from one another.
This analysis covers 444 complete performances from 13 French competitions held in 2025 and 2026, published as open data on data.gouv.fr. It answers one question: which of the four movements actually explains the gap between athletes.
| What the data shows | |
|---|---|
| Performances analysed | 444 (valid, all four movements recorded) |
| Squat share of the total | 51.3% |
| Muscle-up share of the total | 4.7% |
| Most unequal movement between athletes | the muscle-up |
| Top quarter vs bottom quarter, on the muscle-up | ×2.47 |
Sommaire
ToggleWhat a total is made of
Averaged over the 444 performances analysed, a total breaks down as follows. Note that the figures are added loads, on top of bodyweight, except on the squat where the bar carries the entire load.
| Movement | Average share of total | Standard deviation | Median | Observed range |
|---|---|---|---|---|
| Squat | 51.3% | 5.7 points | 50.4% | 38.6 to 78.7% |
| Dips | 27.3% | 3.3 points | 27.7% | 13.6 to 35.7% |
| Pull-ups | 16.8% | 2.5 points | 16.9% | 7.6 to 24.5% |
| Muscle-up | 4.7% | 2.1 points | 5.0% | 0 to 10.2% |
The ranking itself surprises no one: the squat recruits the most powerful muscle groups and therefore carries the heaviest loads. The typical ratios between movements are strikingly consistent: a competitor lifts a median of 1.80 times more on squat than on dips, 1.63 times more on dips than on pull-ups, and 3.36 times more on pull-ups than on muscle-up.
A remarkably stable breakdown
The striking finding is not the ranking, it is its stability. Half of all competitors place between 47.2% and 54.5% of their total on the squat. For dips the range is tighter still: 25.5% to 29.4%.
In other words, competitive streetlifting does not really produce an "upper-body specialist" profile set against a "squat specialist" profile. Athletes resemble each other far more than one would expect in the way they build a total. Extreme cases exist, up to 78.7% of the total on the squat, but they are exceptions, usually the mark of a partly failed day on the other movements.
This has a direct consequence: if the breakdown barely varies, then changing your breakdown is not how you move up the rankings. Raising the whole thing is. The question is where the leverage lies.
Women and men do not build the same total
The average breakdown hides a clear difference between the sexes.
| Movement | Women (100 perf.) | Men (344 perf.) | Gap |
|---|---|---|---|
| Squat | 58.1% | 49.3% | +8.8 points |
| Dips | 23.5% | 28.4% | -4.9 points |
| Pull-ups | 14.5% | 17.4% | -2.9 points |
| Muscle-up | 3.9% | 5.0% | -1.1 point |
Among women the squat carries close to six tenths of the total, against barely half among men. The explanation lies in the nature of the movements: on dips, pull-ups and muscle-up the athlete first moves their own body and only adds a supplementary load, whereas on the squat the bar carries everything. The three upper-body movements therefore produce mechanically smaller added loads, and the effect is more pronounced for women.
Programme ou coaching ?
Trouve ton format idéal
Réponds à 4 questions et reçois une recommandation personnalisée selon ton niveau et tes objectifs.
Faire le quiz →The heavier the class, the more the squat dominates
The same pattern shows up within each sex, class by class.
| Weight class | Squat | Dips | Pull-ups | Muscle-up |
|---|---|---|---|---|
| Women -52 kg | 54.1% | 25.3% | 15.3% | 5.3% |
| Women -57 kg | 57.2% | 23.1% | 15.2% | 4.5% |
| Women -63 kg | 59.1% | 23.2% | 14.3% | 3.5% |
| Women -70 kg | 61.3% | 22.3% | 13.9% | 2.5% |
| Men -66 kg | 47.6% | 28.3% | 18.4% | 5.8% |
| Men -73 kg | 49.2% | 28.4% | 17.3% | 5.1% |
| Men -80 kg | 48.8% | 28.2% | 17.9% | 5.1% |
| Men -87 kg | 50.3% | 28.6% | 16.6% | 4.4% |
| Men -94 kg | 49.6% | 28.7% | 17.2% | 4.5% |
| Men -101 kg | 53.7% | 27.5% | 15.7% | 3.1% |
The progression is steady among women: from 54.1% squat at -52 kg to 61.3% at -70 kg, while the muscle-up share is cut in half. Among men, the lighter classes are the most well-rounded, with 18.4% pull-ups and 5.8% muscle-up at -66 kg, against 15.7% and 3.1% at -101 kg.
None of this is surprising: the heavier the bodyweight, the costlier it is to move it, and the smaller the added load on bodyweight movements becomes in proportion. The squat, on the other hand, benefits from size.
What actually separates athletes
Here is the heart of the matter. Weighing heavily in the total and making the difference are two different things. To measure the second, we break down the spread in level between athletes of the same weight class, and look at how much of that spread each movement explains.
| Movement | Share of total | Share of the gap between athletes | Reading |
|---|---|---|---|
| Squat | 51.3% | 42.0% | weighs more than it separates |
| Dips | 27.3% | 30.7% | separates slightly more than it weighs |
| Pull-ups | 16.8% | 16.7% | balanced |
| Muscle-up | 4.7% | 10.6% | separates twice as much as it weighs |
The squat is the common foundation: everyone trains it, everyone lifts a lot on it, and the gaps there stay relatively contained. The muscle-up, by contrast, makes up only a twentieth of the total yet explains more than a tenth of the differences in level at equal bodyweight. Relative to its weight, it is the most discriminating of the four.
The muscle-up, the most unequal movement
The spread of loads confirms it beyond doubt. Within a single weight class, the relative gap between athletes is:
| Movement | Spread at equal bodyweight |
|---|---|
| Squat | 14.5% |
| Pull-ups | 20.7% |
| Dips | 21.1% |
| Muscle-up | 56.0% |
Now compare the top quarter of the field with the bottom quarter, athletes ranked by their relative strength index.
| Movement | Top quarter | Bottom quarter | Ratio |
|---|---|---|---|
| Squat | 206.6 kg | 151.3 kg | ×1.37 |
| Dips | 120.0 kg | 78.9 kg | ×1.52 |
| Pull-ups | 73.1 kg | 48.9 kg | ×1.49 |
| Muscle-up | 25.6 kg | 10.4 kg | ×2.47 |
| Total | 425.1 kg | 289.4 kg | ×1.47 |
The best lift 37% more than the rest on the squat, but nearly two and a half times more on the muscle-up. It is also the only movement whose share of the total rises markedly with level: 6.0% in the top quarter against 3.5% in the bottom quarter, while the squat share falls from 53.3% to 49.1%.
One point of honesty is due. In absolute terms the largest gap remains the squat: 55 kg between the two quarters, against 15 kg on the muscle-up. A kilo is a kilo, whichever movement it comes from. What these figures show is that the muscle-up is the least evenly mastered movement, and therefore the one where most competitors still hold the largest relative room to improve.
What this changes in training
Three lessons emerge, to be taken for what they are: statistical findings about a population of competitors, not a personal prescription.
The squat remains essential, but it will not set you apart. It carries half the total and must be trained accordingly. It is simply that, at equal bodyweight, most competitors sit within a narrow band. Pouring extra effort into it yields diminishing returns in ranking terms.
Dips deserve better than their reputation. Second contributor to the total and second source of separation, they offer an attractive ratio between training volume invested and kilos gained on the total.
The muscle-up is the movement not to neglect. It is the most technical of the four, the one demanding the most coordination, and that is precisely why the gaps there are so wide. An athlete stuck at 10 kg while rivals carry 25 loses far more than the 15 kg on the scoresheet: they lose the most accessible room to improve in their whole total.
These imbalances are corrected by programming that treats the four movements as one system rather than four separate workouts. That is the approach behind our streetlifting training programs, built around the logic of the total.
Method, data and reuse
The analysis covers the 444 performances for which all four movements are recorded and the performance was validated, out of the 497 rows in the dataset. Failed performances and incomplete result sheets are excluded, without which the calculated shares would be meaningless.
The "share of the gap between athletes" is obtained by decomposing the variance of totals within each weight class holding at least ten performances, then averaging across the ten classes retained. Working within classes is essential: comparing a -66 kg athlete to a -101 kg athlete would mostly measure a difference in size.
The source data is freely downloadable from data.gouv.fr under the Open Licence 2.0, together with its data dictionary and a full account of known quality limitations: Streetlifting in France, competition results 2025-2026. It covers 13 competitions, from regional meets to the French national championship, and athletes are pseudonymised.
For an introduction to the discipline itself, its rules and its movements, see our complete guide to streetlifting.